Every time a Fynex user clicks a button, their request quietly travels through a long chain of moving parts. It enters through Route 53, passes AWS WAF and CloudFront, hits the Application Load Balancer, lands on an NGINX ingress inside our EKS cluster, gets routed to one of several microservice pods, and from there fans out to Amazon RDS, Amazon EFS, Amazon OpenSearch, and asynchronous paths through Amazon EventBridge, SQS, and SNS. A single "save" or "search" can touch a dozen components across two availability zones.
That is the blessing and the curse of a microservices architecture on Kubernetes. The blessing is independent scaling and clean service boundaries. The curse is that when something gets slow or breaks, "where" becomes a genuinely hard question. Logs tell you what happened inside one service. Metrics tell you that latency went up. Neither tells you which hop in the request path caused it. That gap is exactly what distributed tracing fills, and it is why AWS X-Ray sits in the Monitoring and Tracing block of the Fynex architecture, right alongside CloudWatch Logs, CloudWatch Alarms, and our dashboards.
This post explains what X-Ray actually does for Fynex, how it plugs into an EKS-based stack, and — just as importantly — the tracing tools we seriously considered and decided against.
The observability problem X-Ray solves for us
Observability is usually described as three pillars: metrics, logs, and traces. In the Fynex design, CloudWatch already covers the first two well. CloudWatch Logs captures per-service and VPC flow log output, CloudWatch Alarms fire on threshold breaches, and dashboards give us the aggregate health view. What was missing was the third pillar — a way to follow one request as a single connected story across every service it touches.
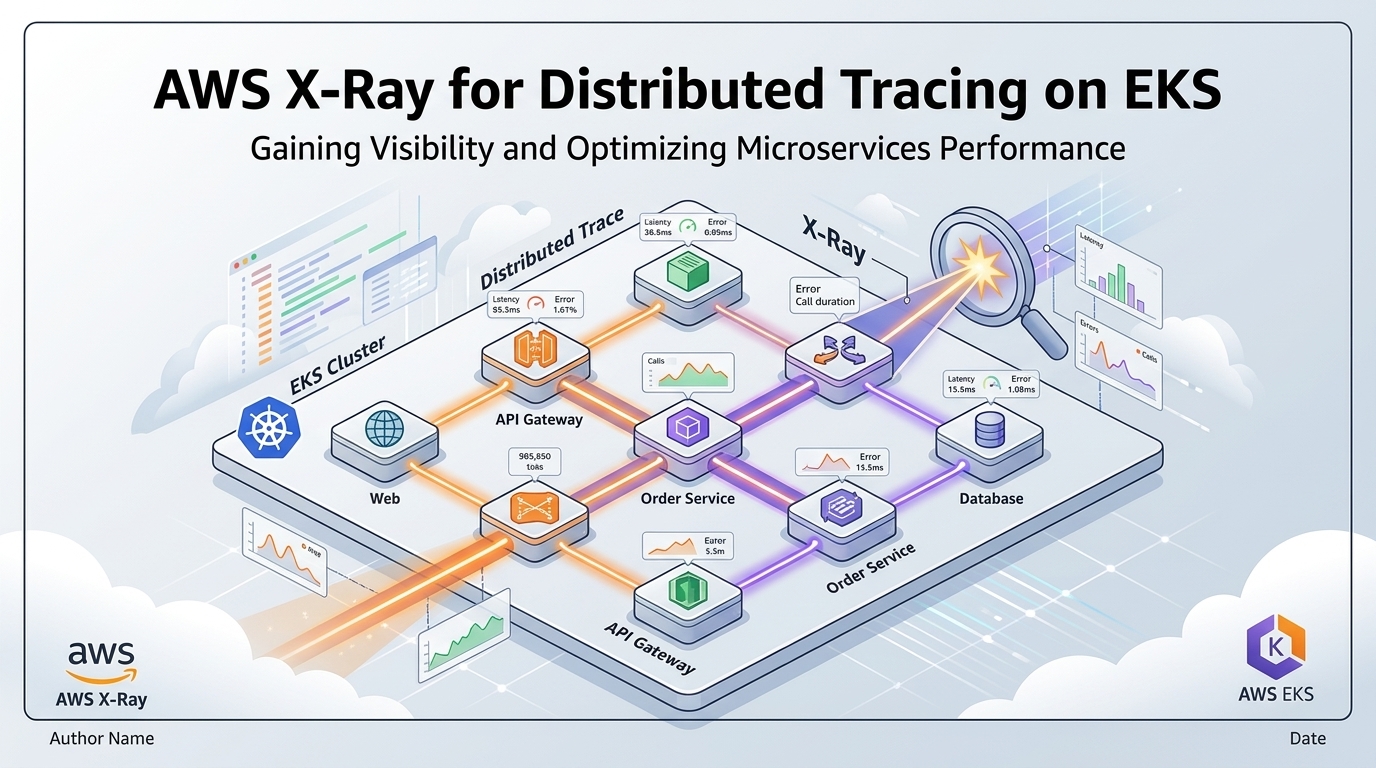
X-Ray provides that story. Each request gets a trace, and each step within it becomes a segment or subsegment with its own timing, status, and metadata. When you stitch those together you get two things that are hard to live without at scale:
A service map. X-Ray automatically builds a topology diagram of Fynex from the traces themselves. You can see the ingress calling the order service, the order service calling RDS and dropping a message on SQS, and so on with live latency and error rates painted on each edge. Nobody has to draw or maintain this map; it reflects reality because it is generated from real traffic.
End-to-end latency and fault attribution. When p99 latency spikes, we open the trace and immediately see whether the time went into application code, a slow RDS query, an EFS read, an OpenSearch call, or waiting on a downstream service. Faults, errors, and throttles are surfaced per segment, so a "500" stops being a mystery and becomes a specific failing call with a stack of context attached.
For a payments/fintech-flavoured platform like Fynex, this matters beyond convenience. Slow or failed transactions are directly revenue- and trust-affecting, and being able to say "the latency is coming from the OpenSearch dependency, not our checkout service" during an incident is the difference between a five-minute fix and an hour of guessing.
Why X-Ray fits an EKS stack specifically
Choosing a tracing backend is not only about features. It is about how cleanly it lives inside the rest of the architecture, and this is where X-Ray earned its place.
Native AWS SDK instrumentation. Fynex talks to a lot of managed AWS services — RDS, S3, SQS, SNS, EventBridge, OpenSearch. X-Ray understands AWS SDK calls out of the box, so those downstream hops appear as traced subsegments with almost no custom code. A self-hosted tracer would need extra instrumentation work to get the same AWS-aware view.
It runs the way Kubernetes wants things to run. Trace collection is deployed as a collector inside the cluster — typically the AWS Distro for OpenTelemetry (ADOT) collector as a DaemonSet or sidecar. Application pods emit spans over OpenTelemetry, the collector batches them, and they land in X-Ray. Crucially, that collector authenticates using EKS Pod Identity (visible in the EKS managed add-ons block of the architecture) mapped to a scoped IAM role. No long-lived credentials, no secrets to rotate for the tracing pipeline.
OpenTelemetry keeps the door open. This is subtle but important. Because Fynex instruments with OpenTelemetry and only uses ADOT to export into X-Ray, our application code is not welded to a proprietary agent. The vendor-specific piece is a thin export layer. If we ever needed to send traces somewhere else, the instrumentation in our services would not have to be rewritten. That single design choice removed most of the lock-in argument against a native AWS tool.
One pane of glass with the existing stack. X-Ray integrates with CloudWatch (ServiceLens / correlated traces, logs, and metrics), which the architecture already relies on. An engineer investigating an alarm can pivot from the CloudWatch metric to the correlated logs to the X-Ray trace without leaving the console or juggling three vendors. Adding a second, unrelated observability tool would have fractured that workflow.
Managed, so we run nothing. X-Ray has no trace store to provision, no ingestion cluster to scale, no storage to size and back up. Traffic goes up, X-Ray absorbs it. For a lean team, "there is no server" is a genuine feature, not a marketing line.
The alternatives we evaluated — and why we passed on them
We did not reach for X-Ray reflexively. Distributed tracing is a crowded space, and each candidate below was assessed against the same yardstick: operational burden, AWS-native integration, cost predictability, data residency, and how well it fit a small team running EKS. Here is the honest reasoning for each rejection.
Jaeger
Jaeger is the CNCF-graduated, open-source default that a lot of Kubernetes shops reach for, and it is genuinely excellent software. The problem is not Jaeger the tracer — it is everything underneath it. Jaeger needs a storage backend to be production-grade, in practice Cassandra or Elasticsearch/OpenSearch, and that becomes a stateful cluster we have to size, scale, secure, upgrade, and back up. We would essentially be adopting a second database tier whose only job is to hold traces. For a team our size, taking on the operational weight of a self-managed trace store to save on a managed service's bill was a bad trade. Jaeger also has no built-in understanding of AWS service calls, so the rich RDS/SQS/S3 subsegment view would have required additional instrumentation effort. We would have paid in engineering time what we saved in service fees.
Zipkin
Zipkin is the older sibling of this family and shares Jaeger's core problem while being generally less actively developed and less feature-rich than modern alternatives. Same self-hosting and storage-management burden, fewer reasons to prefer it over Jaeger, and the same lack of native AWS awareness. It was ruled out quickly for the same reasons as Jaeger, without Jaeger's momentum to compensate.
Grafana Tempo (with Grafana + object storage)
Tempo is an attractive, cost-efficient trace backend that stores spans cheaply in object storage and pairs beautifully with Grafana and Loki. If Fynex were already all-in on a self-hosted Grafana observability stack, Tempo would have been a strong contender. But we are not — our metrics-and-logs backbone is CloudWatch, not Grafana. Adopting Tempo would have meant standing up and operating a whole parallel observability platform (Grafana, Tempo, and its object-storage plumbing) just to get traces, and then living with a split-brain setup where logs and metrics are in one world and traces in another. The integration cost and the operational surface outweighed Tempo's low storage cost.
Datadog APM and New Relic
These are the polished commercial SaaS options, and technically they are superb — arguably richer than X-Ray for high-cardinality trace analysis and slick UI. Two things pushed them off the list. First, cost and cost predictability: usage-based host and span pricing for a chatty microservices platform can escalate fast and unpredictably as Fynex scales, and cross-account data egress adds to the bill. Second, data residency and lock-in: trace data — which can carry sensitive request context — would leave AWS and live with a third party, and the deep agent integration makes migrating away later genuinely painful. For a fintech-adjacent platform where keeping telemetry inside our own AWS boundary is a compliance and trust advantage, sending it to an external vendor was a hard sell that the extra features did not justify.
Elastic APM
Elastic APM was interesting because we already run OpenSearch, so the "reuse what we have" instinct kicked in. But OpenSearch in the Fynex architecture is provisioned for application search workloads, not for absorbing a firehose of trace data, and mixing the two would risk resource contention on a component that is on the critical user path. Running a separate Elastic/OpenSearch cluster dedicated to APM lands us right back in the Jaeger problem: a stateful cluster to operate purely for observability. Not worth it.
The common thread
Every rejected option lost on the same axis in the end. The self-hosted tools (Jaeger, Zipkin, Tempo, Elastic APM) traded a service bill for operational burden and a stateful cluster we did not want to babysit. The commercial SaaS tools (Datadog, New Relic) traded operational simplicity for unpredictable cost, external data residency, and heavier lock-in. X-Ray sat in the sweet spot: managed (nothing to run), native to the AWS services Fynex already leans on, integrated with our existing CloudWatch workflow, keeping trace data inside our AWS account, and — thanks to OpenTelemetry/ADOT — not actually locking our instrumentation in.
Being honest about the trade-offs
Choosing X-Ray is not choosing a perfect tool, and pretending otherwise would undercut the decision. X-Ray's query and analysis experience is more basic than Datadog's or Honeycomb's when you need deep, high-cardinality slicing of traces, and its default trace retention window is limited, so long-term trace archaeology needs a deliberate export strategy. Its UI is functional rather than delightful. We accepted these because Fynex's day-to-day need is fast fault attribution during incidents and clear latency visibility across the service map — which X-Ray does well — rather than exploratory data-science-grade trace analytics. And because our instrumentation is OpenTelemetry-based, the escape hatch is real if that calculus ever changes.
The takeaway
In the Fynex architecture, AWS X-Ray is not a bolt-on nicety. It is the third pillar of observability that turns a sprawling EKS microservices graph from an opaque black box into a navigable map. It tells us not just that a request was slow, but exactly where the time went — across ingress, application pods, RDS, EFS, OpenSearch, and the asynchronous SQS/SNS/EventBridge paths. It does this while running nothing of its own, authenticating cleanly through EKS Pod Identity and IAM, keeping trace data inside our AWS boundary, and slotting into the CloudWatch workflow the team already lives in.
The alternatives were not bad tools. They were the wrong fit for a small team running a managed, AWS-native, security-conscious platform. X-Ray was the option that gave Fynex distributed tracing without asking it to become a distributed-tracing infrastructure operator — and, by way of OpenTelemetry, it did so without closing any doors.